
CBT Tax Database
Data Description
Oxford University Centre for Business Taxation
February 2026
Introduction
This introduction briefly describes the data on corporate income tax systems that has been collected by the Oxford University Centre for Business Taxation and is now available on this site. It provides a detailed information on all the variables available, the country and year coverage. Since the development of the database is an ongoing work, more information will become available over time. This note refers to the state of the database as of January 2019.
The information in this database for the years 2002 – 2012 has been used in the CBT Corporate Tax Ranking 2012. The database includes raw data variables such as corporate tax rates, aspects of the legal definition of the corporate tax base (depreciation rates and types), and inventory valuation methods. It also includes measures of EATRs and EMTRs as used in the CBT Corporate Tax Ranking 2012. The database covers G20 and OECD countries over the period 1983 – 2019 (in some case 1979 – 2019) as specified below.
The CBT database builds on an existing database which has been created in 2006 as a multi-country database and developed over the years by various Research Fellows at the Centre, and earlier at the Institute for Fiscal Studies. The original version uses various sources such as OECD Tax Database, IBFD (International Bureau of Fiscal Documentation), World Tax Database from the University of Michigan, KPMG and E&Y and covered mainly OECD countries. The data currently in the database comes from various sources, mainly from:
- The Worldwide Corporate Tax Guide published by E&Y; years available: 2002-2019
- Data for 2011 - 2019 comes mainly from the online IBFD Tax Research Platform where they provide very detailed Country Surveys
- G20 countries data has been updated to be consistent with IBFD "Global corporate tax handbook" (years 2007 - 2010) and "European tax handbook" (years 1990 - 2010)
- ZEW Intermediate Report 2011, “Effective Tax levels using Devereux/Griffith methodology”
- Deloitte Tax Highlights and International Tax and Business Guide; years available: 2009, 2010
- KPMG Tax Rate Survey; years available: 1998 - 2009
- PKF Worldwide Tax Guide; years available: 2007 - 2009
We update the database each year to make it consistent with the most recently available information. We aim to make sure that the all the information included in the database applies in 1 January of the given year. Therefore if the tax year is different than calendar year, any reforms introduced in a given tax year that started after 1 January will not appear in the data until the following year.
This brief description is organized as follows: section 2 lists all the countries covered in the sample, section 3 explains in more detail the features of each of the variables and what they comprise of. Section 4 explains how to obtain the data from the database and who to contact in case of any queries.
Country and year coverage
The database consists of 43 G20 and OECD countries. 34 countries belong to the OECD and 19 are the G20 members. Some countries are members of both groups. Data for the following countries is available: Argentina, Australia, Austria, Belgium, Brazil, Canada, Chile, China, Czech Republic, Denmark, Estonia, Finland, France, Germany, Greece, Hungary, Iceland, India, Indonesia, Ireland, Israel, Italy, Japan, South Korea, Luxembourg, Mexico, Netherlands, New Zealand, Norway, Poland, Portugal, Russia, Saudi Arabia, Slovak Republic, Slovenia, South Africa, Spain Sweden, Switzerland, Turkey, United Kingdom, and United States.
The years covered span the period 1983 – 2017 for most of the countries, some data is available for the period 1979 – 2019.
Variables available
Corporate tax rate
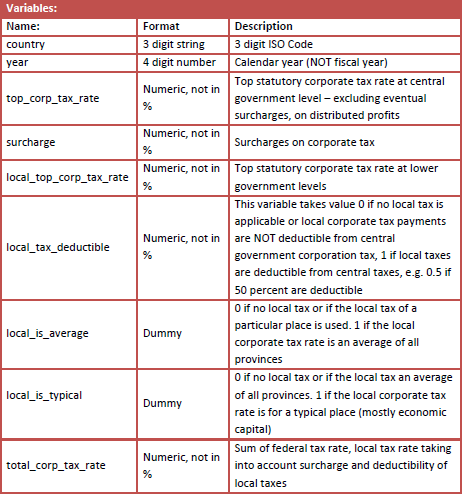
The corporate tax rates worksheet contains information on the statutory corporate tax rates in each country. The file consists of columns describing country code, year, top corporate tax rate at federal level, any surcharge levied, any local corporate tax rate (also whether it is based on an average of localities, or is a “typical” rate) whether local tax is deductible and finally the total corporate tax rate, which is the sum of all the tax rates that exist in a given country in a given year taking into account the deductions available.
Note: The local business tax in Canada for years 2011 and 2012 has been changed from 13% used in the CBT Corporate Tax Ranking 2012 to 11.75% according to suggestions received upon the report publication.
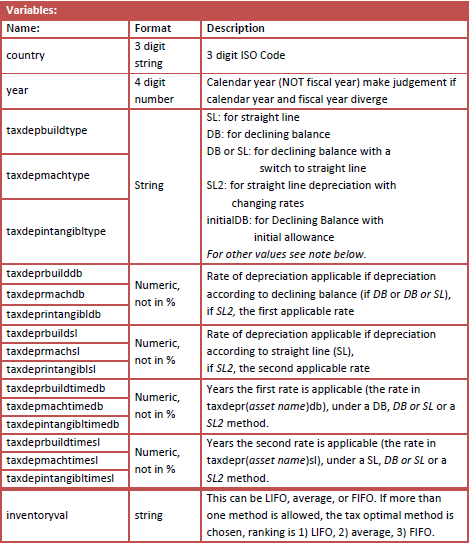
Corporate tax base
The corporate tax base worksheet includes information on the depreciation rates and types and inventory valuation method. It describes three assets: industrial buildings, plant and machinery and intangibles (patents) and for each of those it has information about depreciation method (either straight line, declining balance, declining balance with a switch to straight line or any variation), depreciation rates and number of years over which the asset is permitted to depreciate. It also includes information on the method of inventory valuation, which can be either last in first out (LIFO), average or first in first out (FIFO). Where more than one valuation method is applicable the most preferable method was chosen (we prefer LIFO over average over FIFO).
Sometimes, for certain assets, data was not available for depreciation rates and methods or else it was stated that depreciation must be computed in accordance with the statutory useful lives of the assets. When this occurred we make assumptions as to what are the useful lives of all three assets used in the database. They are as follows:
- for industrial buildings: 25 years useful life
- for plants and machinery: 7 years useful life
- for patents: 10 years useful life
The depreciation rates were computed accordingly.
Note: CZK30, CZK06, CZK41, CZK20 refer to Czech Republic and Slovakia, where depreciation does not follow the typical method of DB or SL. The depreciation of one year is determined by the useful life of the asset and the remaining years of depreciation. In the first year in the case of plant and machinery with a useful life of 6 (CZK06) years, depreciation is 16.7% (100/6). The following years, the residual value is multiplied by two and divided by the remaining years of depreciation plus one year; i.e. for the second year: (100-16.7%) x 2 / (6-1+1)= 27.77%.
SLITA: In Italy in the years 2002 – 2007 there was a special additional depreciation available for industrial buildings and plants and machinery. It was additional double depreciation for year 2 and 3 at twice the SL rate.
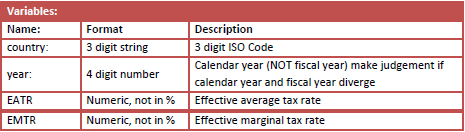
Effective average tax rate (EATR) & Effective marginal tax rate (EMTR)
The EATR and EMTR worksheet includes measures of the both effective tax rates. The file consists of columns describing country code, year, EATR and EMTR. For a description of the methodology and the assumptions used in the calculation of the EATRs and EMTRs please refer to Appendix A in the CBT Corporate Tax Ranking 2012. However, there are two exceptions from the methodology of the 2012 Report. First, the figures for EATRs and EMTRs do not include any investment in inventories. Second, the EMTR is calculated by scaling by the tax-free return (r), not the cost of capital (p).
How to access the data
The database consists of a single Microsoft Excel file with three worksheets corresponding to the information described in Section 3. If you have any queries regarding the information in the data please email: cbt@sbs.ox.ac.uk.